The Mountain Weather Forecast, which is produced by the Meteorological Service of Canada, is one of Avalanche Canada’s most read and most valuable products. This glossary is designed to help you understand the terms that are used so you can get the most value out of it.
Click here for our comprehensive avalanche glossary.
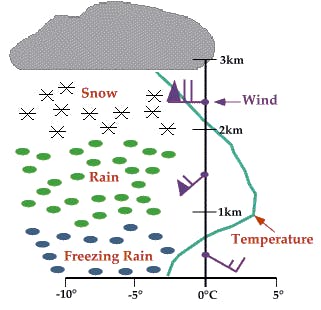
Caption: This graphic shows a hypothetical vertical temperature structure (green line) with an AFL located between 2,000 m and 700 m above the earth’s surface. As a snow crystal falls from the base of a cloud (left side of diagram), it will eventually melt and transition to rain as it descends through the AFL. Since the air temperature changes to subfreezing temperatures below 700 m, water droplets become supercooled and freeze on contact when they reach the ground (freezing rain). If the depth of the surface-based cold layer were greater, it would give water droplets enough time to freeze completely while in the air, and reach the groundas ice pellets.
An above freezing layer (AFL) is a horizontal layer of air at some altitude in the atmosphere with a temperature above 0 C. It lies between two layers of sub-freezing air. AFLs are a common result of atmospheric subsidence and incoming warm fronts overriding cold air entrenched within valley bottoms. A temperature inversion is always present at the bottom of the layer.
Note that warm air at valley bottom is not referred to as an above freezing layer because air is normally warmest at low elevations.
Elevated layers of above freezing air play an important role in the type of precipitation observed at a given altitude. Above an AFL, precipitation falls as snow. It then transitions to rain within the AFL (assuming the layer is of sufficient depth), and then to ice pellets or freezing rain below the AFL.
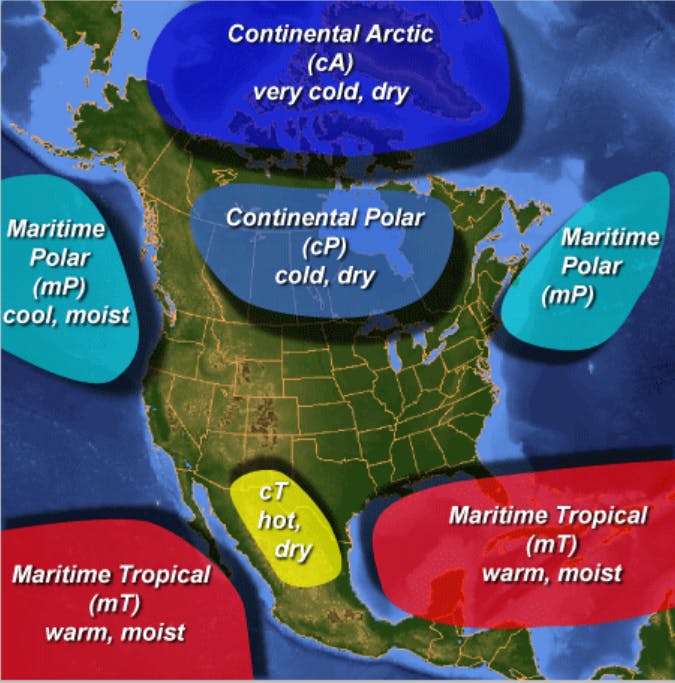
An air mass is a large region of air with minimal horizontal variation in temperature and moisture. An air mass forms when air remains stationary for enough time (usually many days or weeks) to exchange energy (absorbing heat or cooling) and moisture with the surface below.
Air masses are classified in two ways, based on where they originated:
By moisture: Air masses that form over land are called continental (dry), while ones that form over oceans are called maritime (moist).
By temperature: Whether they are from tropical (warm), polar (cold) or arctic (extremely cold) regions.
There are a total of six air mass types: continental tropical (cT), maritime tropical (mT), continental polar (cP), maritime polar (mP), continental arctic (cA), and maritime arctic (mA). Maritime arctic air masses affect BC’s coast when continental arctic air pushes through coastal fjords. Strong to very strong northerly/northeasterly outflow winds occur and localized bands of heavy snow (known as streamers) pummel communities and mountains downstream (e.g. eastern Vancouver Island).
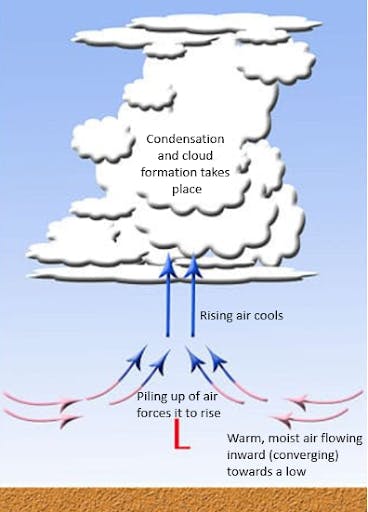
Schematic of warm, moist air converging towards an area of low pressure where it is then forced to rise.
Atmospheric convergence refers to two or more streams of air flowing into one another, or when stronger winds flow into slower winds. This piling up of air at low levels of the atmosphere results in atmospheric lift, or rising air. As air converges and lifts, cooling takes place, leading to condensation, cloud formation and, ultimately, precipitation.
Atmospheric convergence is one of the key processes involved with storm development and precipitation. In the mountain environment, convergence occurs on windward slopes and at the heads of valleys and fjords, leading to stronger winds and enhanced precipitation in those locations.
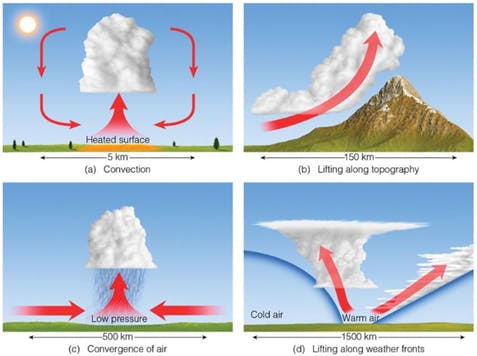
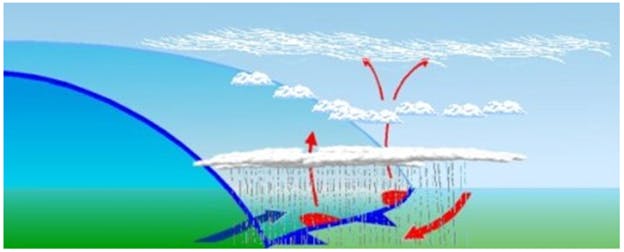
Cloud formation illustrated by the four processes responsible for atmospheric lift.
Atmospheric lift is a general term referring to a group of processes that cause air masses to rise upwards in the atmosphere. It is significant because it leads to the formation of precipitation. Rising air cools, losing its capacity to hold water vapour, and the vapour turns into water droplets or ice crystals. Clouds form and, when the weight of water droplets or ice crystals becomes too great, they fall as precipitation.
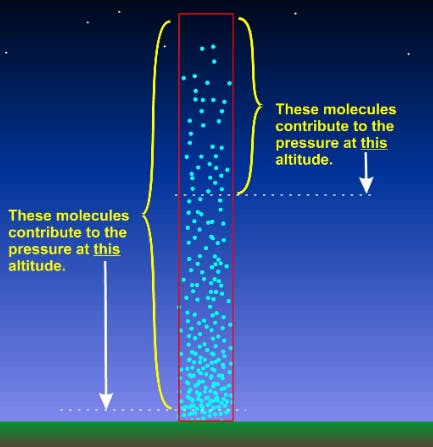
A column of air showing the number of air molecules contributing to atmospheric pressure at two different altitudes.
Credit
Environment and Climate Change Canada
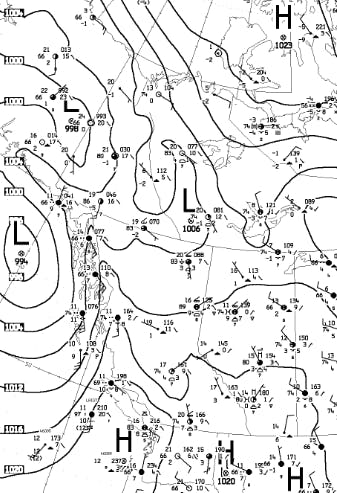
Surface weather map analysis of atmospheric pressure converted to sea level pressure. Isobars (black lines) connect points of equal pressure, and areas of low (L) and high (H) pressure are indicated.
Atmospheric pressure is a fundamental weather element and refers to the weight of a column of air pressing down on a given area. It is commonly expressed in units of millibars (mb). A surface weather map shows the pressure pattern as measured by weather stations (converted to sea level pressure to eliminate changes in elevation) across the globe, with isobars connecting points of equal pressure.
Not only does the current pressure pattern act as a useful indicator of likely weather, but changes in the pressure pattern indicate the weather that is likely to come.
If pressure is falling, it usually signifies the approach of a low pressure system, and its associated deteriorating weather.
Rising pressure comes with many meanings. Following a passing front or low pressure system, surface pressure rises and conditions generally improve. However, a rapid increase in pressure may bring a burst of strong winds. In winter, an arctic ridge of high pressure seeping down from the north may bring harsh temperatures and persistent valley cloud, but sunshine in the alpine.
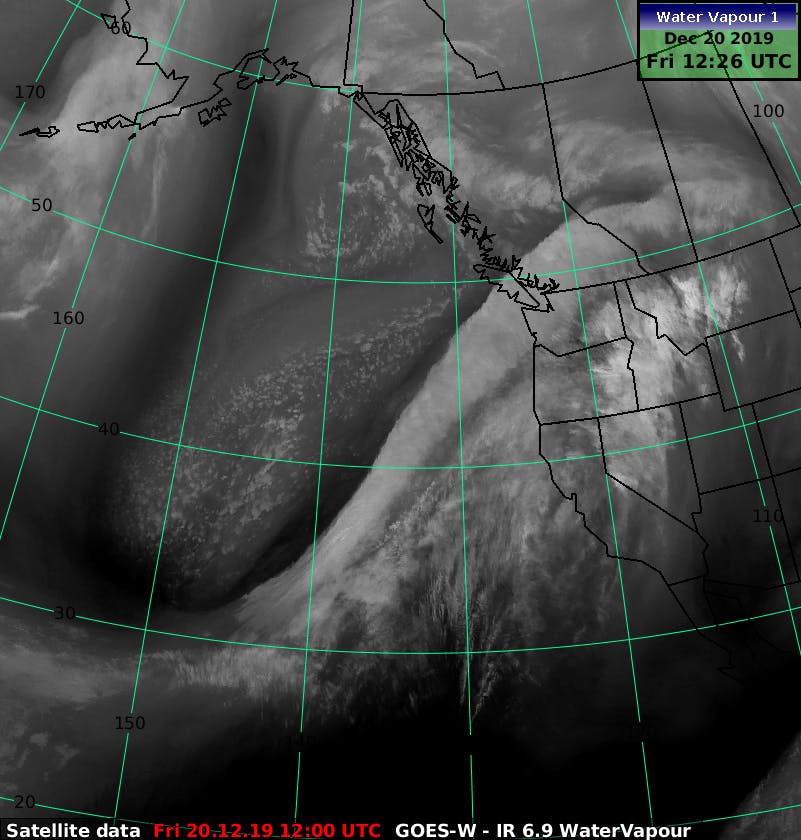
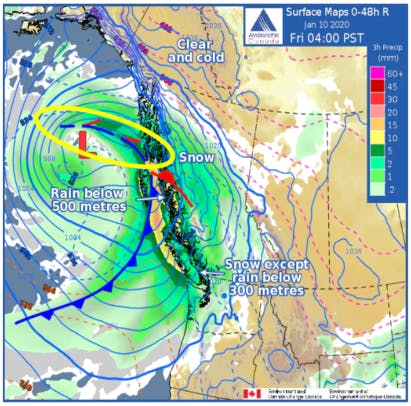
A satellite image of an atmospheric river moving from the sub-tropics to the southern coast of BC.
Atmospheric Rivers (ARs) are long, narrow plumes of moisture originating from the tropics that deliver heavy amounts of precipitation and mild air. A well-known example is the “Pineapple Express” that originates near Hawaii and delivers heavy rain and snow to the west coast of North America.
ARs are responsible for 30-50% of our annual precipitation on the west coast. The strongest ones can deliver over 200mm of precipitation in a period of 36 to 48 hours. Given their warm source region, freezing levels rise significantly with the arrival of atmospheric rivers--typically over 2,500m along the coast and over 1,500m in the interior of BC.
About 25 to 35 ARs hit BC’s coast each year, primarily during the late fall and winter seasons. The most intense produce damaging floods, landslides, and widespread natural avalanche cycles. While the onset of an AR can deliver copious amounts of mountain snow, rising freezing levels typically result in rain to almost all elevations by the end of the storm. Freezing rain is another common occurrence in the valleys of the BC Interior, particularly when ARs are preceded by well-entrenched Arctic air.
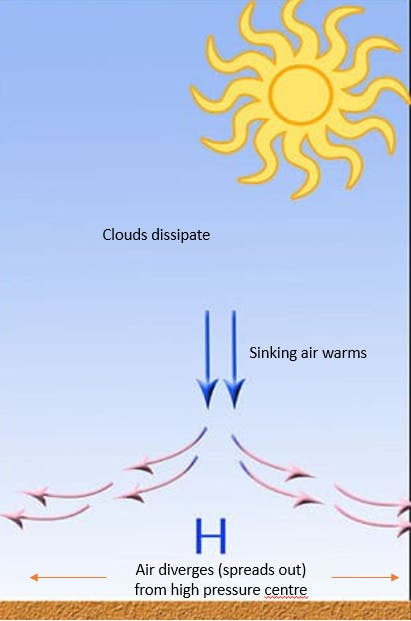
Sinking air parcels warm via compression and spread outwards upon reaching the surface of the earth. Resultant weather typically consists of clear skies and light winds, though exceptions do occur.
Atmospheric subsidence is the downward movement (sinking) of air parcels in the atmosphere. It is the opposite of atmospheric lift. This movement compresses the air, which increases both the temperature of an air mass and its capacity to hold water vapour. The net effect is a lowering of an air mass’s relative humidity, and the dissipation of clouds and precipitation.
While subsidence often leads to clear skies, a caveat is the formation of valley cloud and the associated drizzle or light, fine snow (frozen drizzle), and/or extensive valley fog. This happens because subsiding air acts as a lid, gradually lowering overtime, trapping moisture and pollution into a smaller and smaller volume. Additional water vapour content may be added from evaporation off open water bodies. When the weather is stagnant, subsidence and evaporation, combined with nighttime cooling, can lead to saturation (the formation of fog or valley cloud). This is common during fall and winter in the mountains.
Timing and success of dissipation, or “burn off”, depends on the strength of the sun (solar angle, length of day), strength of the subsidence inversion, depth of the cloud/fog layer, and local wind patterns.
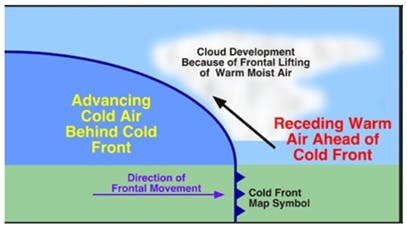
The solid blue line with triangles represents a cold front moving into BC from the Pacific Ocean.
Credit
M. Pidwirny
A vertical slice through a cold front showing how warm, moist air is lifted upwards by the advancing wedge of cold air.
Credit
M. Pidwirny
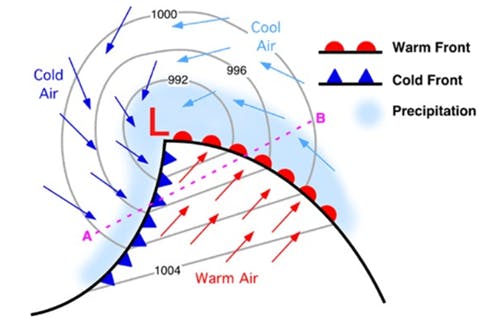
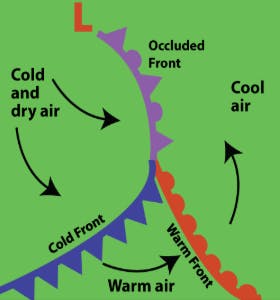
A bird’s eye view of a low pressure system and its associated fronts. Coloured arrows indicate wind direction and air temperature.
The interface where a cold air mass advances towards a warm air mass is called a cold front. Cold fronts generate atmospheric lift as their associated cold, dense air mass wedges under and lifts the warmer, less dense air it advances upon. Cold fronts are represented on weather maps by a solid blue line with blue triangles pointing in the direction the front is moving.
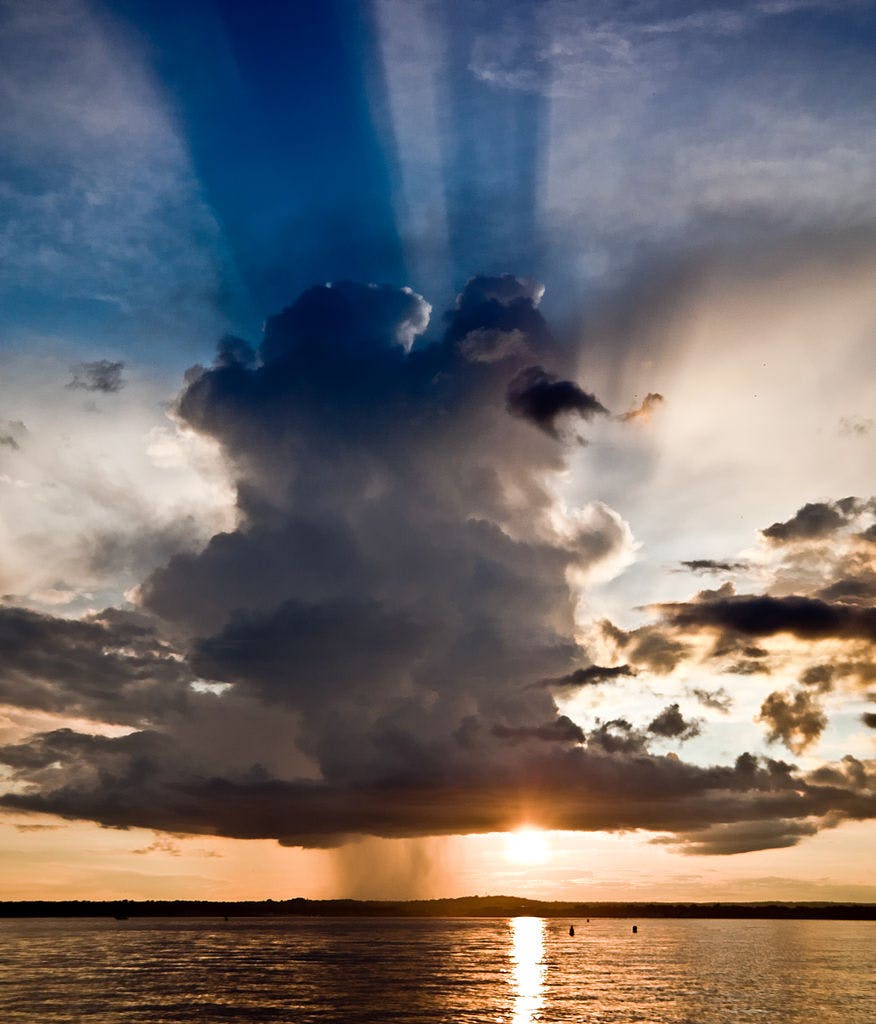
Strong convective lift can result in the formation of cumulonimbus clouds.
Credit
Brockmann Consult
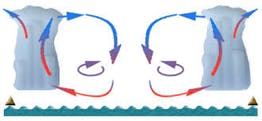
Convective circulations showing rising, cooling and condensing air (red arrows transitioning to blue, clouds), and sinking, warming and drying air (blue arrows transitioning to red, no clouds).
Convection is the vertical movement of air in which warm air rises (picture bubbles rising to the top in a boiling pot of water) and cool air sinks. Like other forms of atmospheric lift, convective lift causes rising air to cool and reach saturation, forming tall clouds and showery precipitation. Precipitation resulting from convective storms is known for being variable in location and duration, with locally intense, short-bursts of precipitation possible. This, in turn, creates greater uncertainty in forecasting precipitation.
Strong convective lift can result in very tall cloud formations called cumulonimbus clouds, which are associated with thunder and lightning.
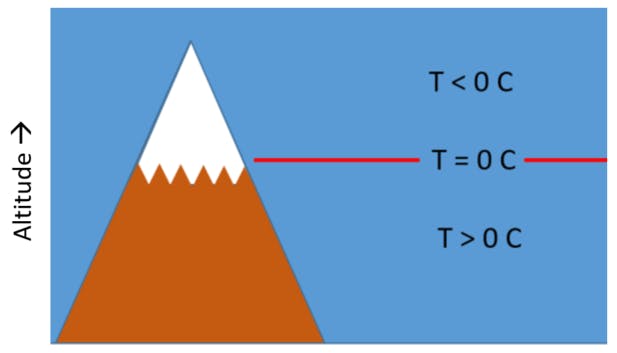
Under normal atmospheric conditions, temperature decreases with altitude. The red line indicates the freezing level, where the temperature equals 0 C.
The freezing level is the altitude at which the air temperature reaches 0 C (zero degrees Celsius). In the atmosphere, temperature typically decreases with height so that the temperature is above 0 C at elevations below the freezing level, and below 0 C at elevations above the freezing level.
However, warm air associated with Pacific frontal systems frequently invades British Columbia during winter, causing warm air to overrun cold arctic air settled in the valley bottoms. This process creates a temperature inversion, where temperature increases with height, and can lead to an above freezing layer with multiple freezing levels.
Rising freezing levels are generally synonymous with rising temperatures and a sign of a warming snowpack.
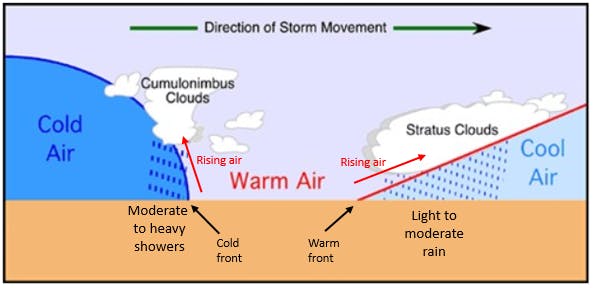
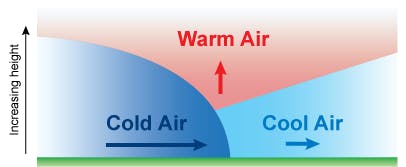
Vertical slice through a frontal system; cold air and cold front (left), warm sector (middle), warm front and retreating cool air (right). Warm, moist air is forced to ascend at both fronts but does so more rapidly at the cold front.
Frontal lift is one of four primary mechanisms of atmospheric lift. Cold fronts, warm fronts, and occluded fronts all force air to rise, and if sufficient moisture is present, form clouds and precipitation.
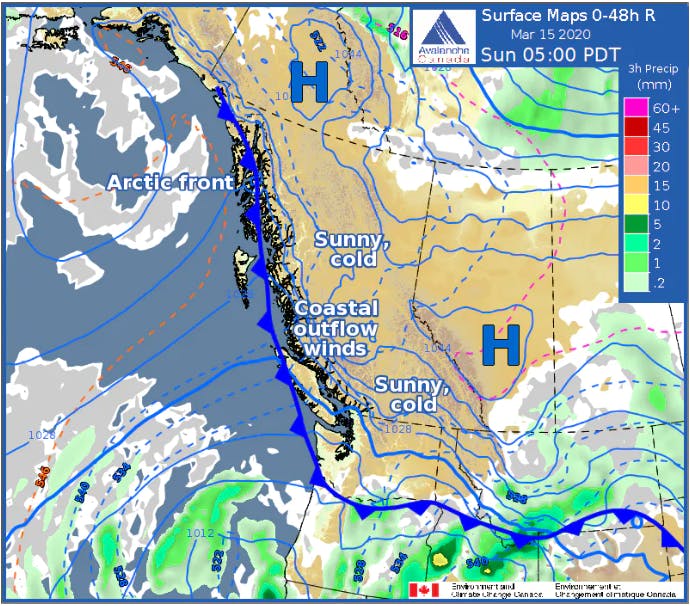
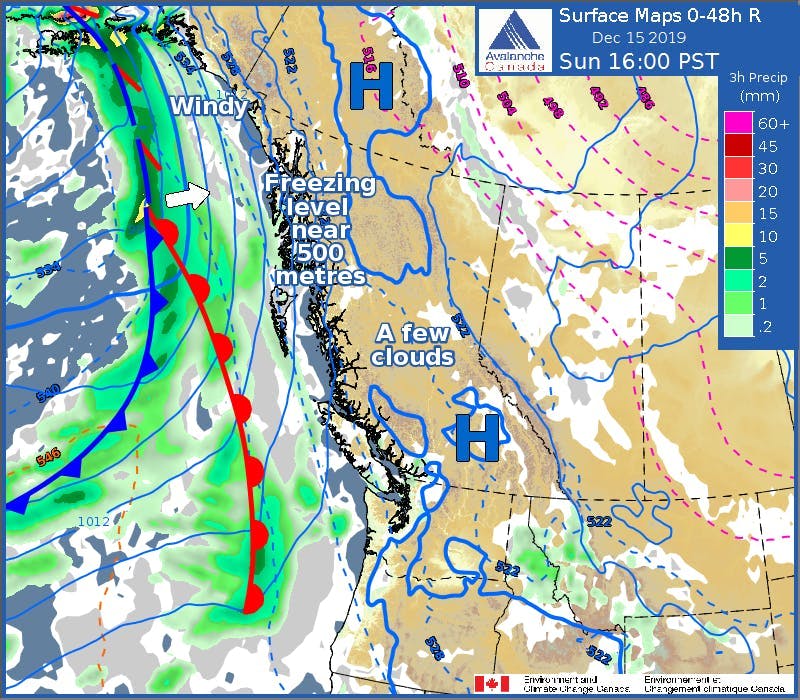
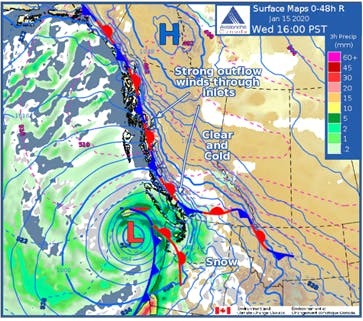
A high pressure system over western Canada creates widespread sunshine. Surface winds are generally light, except in this weather map example where tightly packed isobars (lines of equal pressure) near the coastal fjords result in strong outflow winds.
High pressure systems generally result in clearer skies and reduced precipitation. Air within an area of high pressure spirals downward towards the earth’s surface and then spreads outwards in a clockwise manner towards areas of lower pressure, resulting in atmospheric subsidence.
An area of relatively high atmospheric pressure surrounded on all sides by lower pressure is referred to as a high. An elongated region of high pressure extending from a high is called a ridge.
It is common for surface hoar and facets to form on the snow surface during periods of high pressure, particularly those that last several days. These become a weak layer when they get buried by subsequent storms and can be responsible for persistent slab problems.
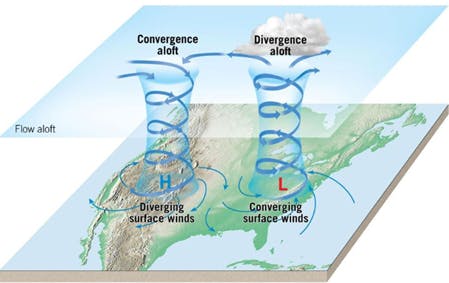
Surface air flows outwards (diverges) from an area of high pressure (H) and spirals counterclockwise into a low pressure system (L). Converging surface air is forced to rise, cooling as it does so. If sufficient moisture is present, cloud formation occurs followed by subsequent precipitation.
Low pressure systems generate cloudy skies, precipitation, and, over time, drastic changes in temperature and wind. Air flows from areas of high pressure to areas of low pressure, spiraling inwards and upwards in a counterclockwise manner, resulting in atmospheric lift.
An area of relatively low atmospheric pressure surrounded on all sides by higher pressure is referred to as a low. An elongated area of low pressure extending from a low is called a trough.
The location of the occluded front is at the Earth’s surface where the cold air meets cool air.
Credit
National Oceanic and Atmospheric Administration (NOAA)
A vertical slice through a mature weather system showing how the faster-moving cold air has pinched off the warm air that was once at the surface (cold occlusion depicted). The TROWAL (elevated front) is drawn at the intersection of cold, cool and warm air.
An occluded front occurs when the faster, trailing cold front of a low pressure system catches up to the slower moving warm front. This process lifts the wedge of warm air originally ahead of the cold front, cutting it off from the ground, and also lifts the warm front itself. A temperature difference across the occluded front is still observed, but it is smaller (cold to cool air instead of cold to warm air). It is represented on international weather maps by a purple line with alternating purple triangles and semicircles pointing in the direction the front is traveling in.
On Canadian surface weather maps, the occluded front is not typically analyzed. Instead, the elevated front, known as a TROWAL (trough of warm air aloft), where the cold front has lifted the warm front off the ground, is drawn.
The heaviest precipitation occurs at the point where the cold front has caught up to the warm front. Here, the temperature contrasts are greatest and lift is amplified.
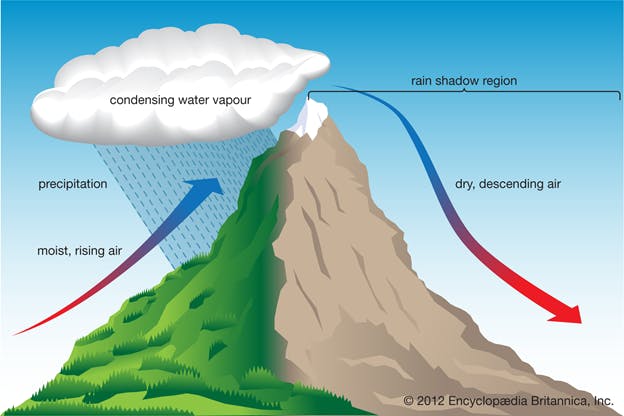
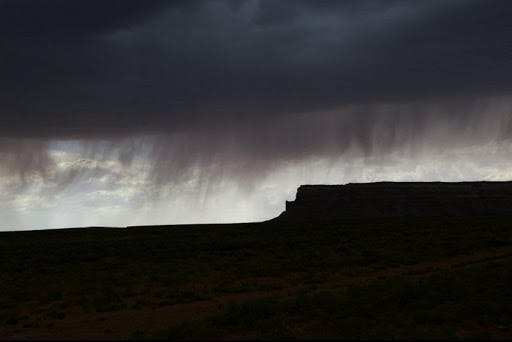
Orographic lift causes precipitation to fall on the windward side of mountains and ranges (shown here on the left), while the leeward side (right) remains dry. Arrows transitioning from red to blue, and vice versa, indicate cooling of rising air and warming of descending air.
Orographic lift takes place when a moving mass of air encounters a physical barrier such as a mountain range and is forced upwards. The rising air cools, condenses and forms clouds. With sufficient lift and moisture, precipitation generally falls on windward slopes and/or near mountain peaks. On the leeward side of mountains (downwind), air descends, warms, becomes drier, and creates an area of lower precipitation, commonly called a rain shadow.
Since the predominant wind direction in the mid-latitudes of North America is from west to east, orographic lift is a key component of precipitation patterns and snowpack depth. Consequently, western-facing (windward) slopes experience higher annual precipitation accumulations than eastern-facing (lee) slopes. Pacific frontal systems will also wring out a larger percentage of their moisture content over the Coast Mountains, with less moisture available to fall over the Columbia and Rocky Mountain ranges.
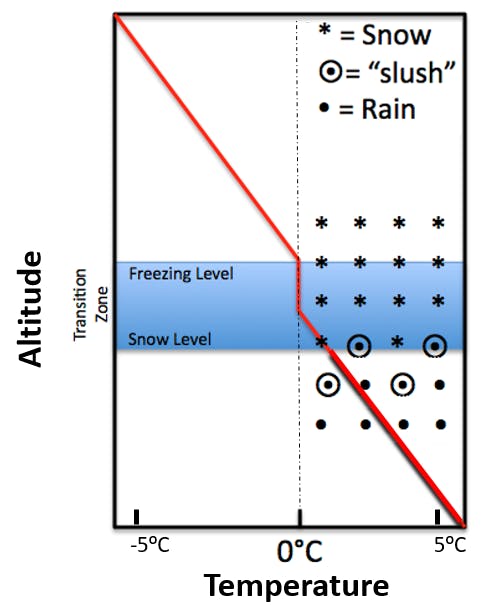
Avalanche Canada’s Mountain Weather Forecast tracks four different types of precipitation: snow, rain, freezing rain, and ice pellets. Each one has a different impact on snowpack structure.
Snowfall builds the snowpack. Recently fallen snow is normally easily transported by wind. Heavy snowfall of more than 2 cm per hour or 30 cm within the last 48 hours, increases avalanche danger. Consistent light snow (5-10 cm per day) makes avalanches less likely.
Rain adds moisture and heat to the snowpack and causes melt. Rain crusts form if surface snow refreezes after rainfall. Any amount of rain on snow can make avalanches more likely. If the rain freezes into a thick crust (3 cm or more), it makes avalanches less likely.
Freezing rain adds less heat to the snowpack than rain and causes minimal snowpack melt. It can rapidly form surface crusts.
Ice pellets form when snow melts into rain droplets and then they fall into arctic air trapped in valley bottoms causing it to change into frozen rain droplets. They are much larger than snow grains and may resist bonding to surrounding snow grains.
Precipitation of any kind adds load to the snowpack and stresses the weak layers within it. Critical loading of weak layers present in the snowpack can occur during rain or heavy snowfall.
The video illustrates how precipitation particles fall to the ground as snow, sleet (ice pellets), freezing rain, or rain depending on the vertical temperature structure in the atmosphere. If the air temperature remains below zero throughout the particle’s descent, it falls as snow. If the air temperature rises above and remains above zero, rain occurs. When a mid layer of warm air overrides cooler, valley bottom air, ice pellets or freezing rain form, the deciding factor being the depth of the cold air in the valley bottoms. Video by The Comet Program.
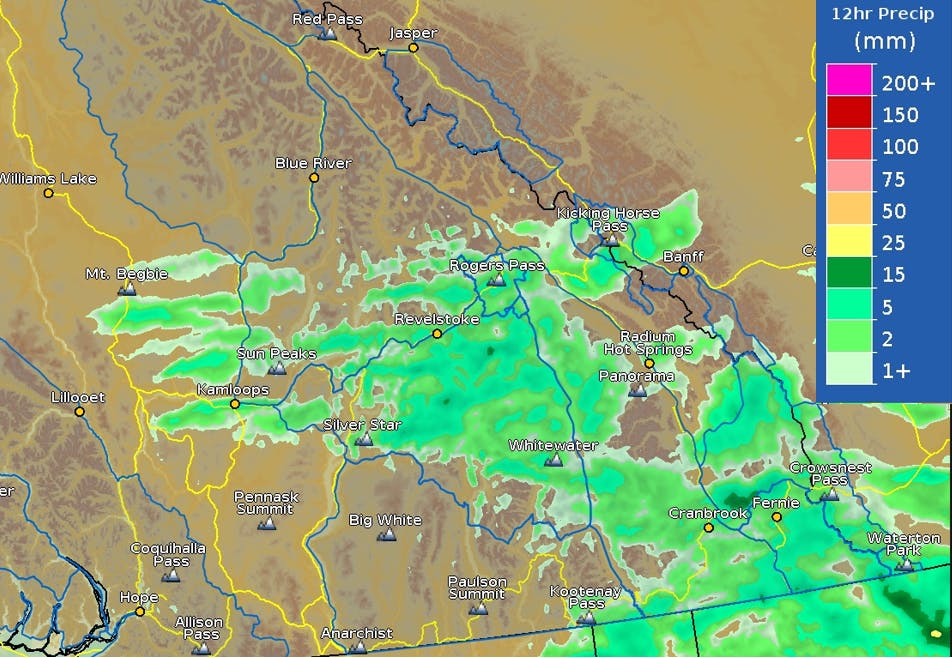
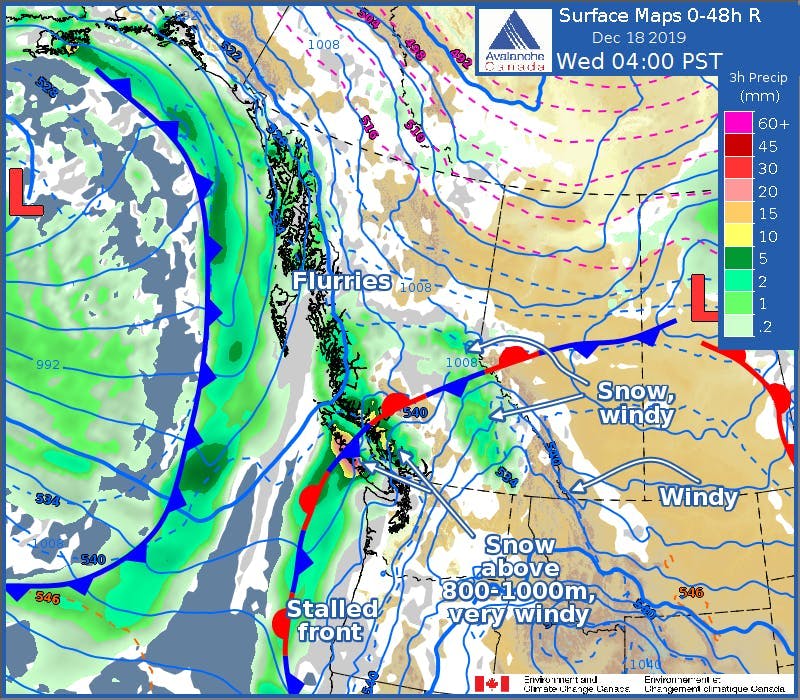
Caption: A map of southeastern British Columbia, showing avalanche forecast regions outlined in blue and major highways in yellow. The 12-hour precipitation forecast is shown in coloured shading.
Quantitative Precipitation Forecast (QPF) refers to the quantity (or amount) of precipitation (usually conveyed in millimetres of water) forecast to accumulate at a given location over a specified period of time. Common time intervals are one hour, three hours, 12 hours, or per storm event.
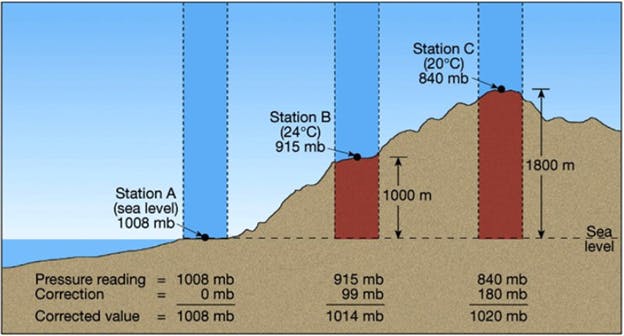
Elevations and temperatures of weather stations A (at sea level), B (at 1,000m above sea level), and C (at 1,800m above sea level) are shown. The calculations below convert each station’s pressure reading to the corrected sea level value. The mathematics take into consideration station altitude, station temperature, and minor instrumentation corrections. In this example, we can now compare each station’s sea level pressure—higher pressure exists inland (right side of diagram) and lower pressure exists near the water (left).
Sea level pressure is a calculated value determined by measuring the actual pressure at a given weather station and correcting it for altitude.
Atmospheric pressure is measured by surface weather stations across the globe. Since the elevation of these stations can vary significantly from the coast of British Columbia to the Rocky Mountains, station pressure (the actual pressure measured at the station) is converted to sea level pressure (the pressure that would exist if that station was at sea level). Doing so simplifies the pressure analysis, allowing meteorologists to compare pressure at different locations.
The mathematics take into consideration station altitude, station temperature, and minor instrumentation corrections. It also includes several assumptions, such as how temperature changes with altitude, which at times, can lead to incorrect values. Erroneous data, if identified, can be ignored or smoothed over while doing a hand analysis of isobars on a weather map.
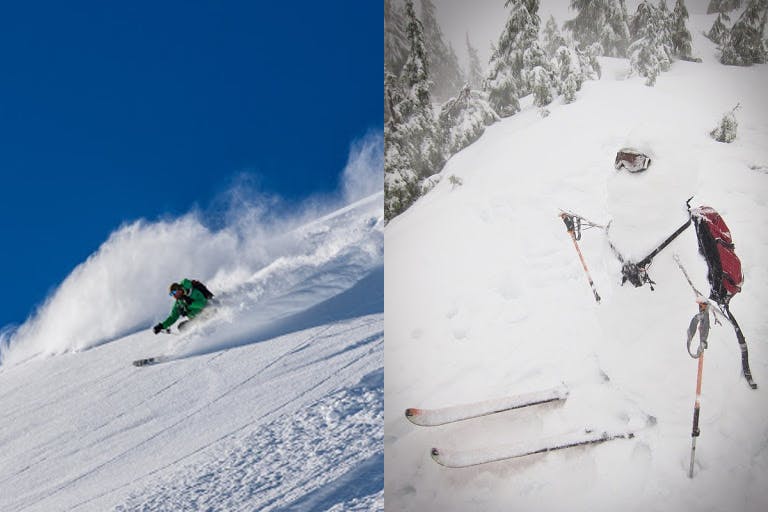
Caption: SLR has a huge impact on snow quality with higher values (15:1, 20:1 or higher) giving low density powder (left), and more mild storms producing denser snow, better used for snow sculptures (right).
The snow-to-liquid ratio (SLR) is a measure used in weather forecasting to describe the water equivalent of forecast new snow. The most basic rule of thumb to follow would be to apply a SLR of 10:1 (i.e., for a snow forecast of 10cm, 1cm (10 mm) of liquid water is expected).
In reality, SLRs vary from 5:1 or 7:1 (commonly found in the westernmost coastal ranges) to 25:1 or more (common in the Arctic and on eastern slopes of the Rockies). The variability of SLR depends on the temperature of the surrounding air throughout the ice crystal’s life cycle (from growth to its descent to earth), the presence of supercooled water droplets within the cloud, shape of the resulting ice crystals, and wind strength within and below the cloud layer.
Numerous weather products predict the quantitative precipitation forecast (QPF, in mm), which requires forecasters and other users to convert to centimetres of snow by applying an appropriate SLR. Since SLR is linked to temperature, colder air tends to produce higher SLR (15:1 or 20:1), resulting in lighter, fluffy powder snow, while warmer temperatures usually mean a lower SLR (7:1 or 5:1) and denser snow, which is excellent for making snowballs.
For example, if 10 mm of precipitation is forecast with mild temperatures, one might apply an SLR of 10:1. Thus, the forecast would call for 10 cm (100 mm) of snow. If precipitation was occurring during a cold snap, one would apply a higher SLR of 20:1. This means the same 10 mm of precipitation will create 20 cm (200 mm) of snow.
The vertical temperature profile shows the transition of below freezing temperatures aloft to mild valley bottom air (freezing level). Precipitation phase is overlaid and illustrates how snow changes to wet snow and then to rain (delineating the snow level) once temperatures rise above 0 C.
The snow level is the altitude at which precipitation changes from snow to rain. How far below the freezing level it is located depends on the amount of cooling that takes place due to sublimation and melting.
If the air mass is dry in the low levels, falling snow will sublimate (change from frozen water to water vapour) and cool the atmosphere. The snow level will quickly plummet from near the freezing level to several hundred metres below.
If the atmosphere is moist, little cooling from sublimation will occur but melting snow (which also cools the atmosphere) still occurs. The harder it is precipitating, the more melting occurs, leading to greater cooling and lowering of the snow level.
A general rule of thumb to determine snow level is to subtract 200-300m from the freezing level, but depending on the atmospheric conditions, snow level may be substantially lower.
The red and blue line on this weather map indicates a stationary front across central BC.
Credit
Damon Stokes
A 3D representation of a stationary front with the wedge of stationary cold air on the left and warm air on the right. Thick arrows at the Earth’s surface provide examples of potential surface wind direction. The vertical red arrows indicate lift near the frontal zone that may produce clouds and precipitation.
A stationary front is an interface between two air masses that are not moving or moving very slowly. Surface winds blowing parallel to the front can help it remain in place for longer.
Weather along the frontal zone depends on the two air masses at play. If both air masses are relatively dry, cloud cover will be scattered with little or no precipitation. If one or both air masses is sufficiently moist, widespread cloud cover with intermittent to steady light precipitation can be expected.
A stationary front is represented on weather maps by alternating blue and red line segments, with blue triangles that point towards warm air and red semicircles that point towards cold air.
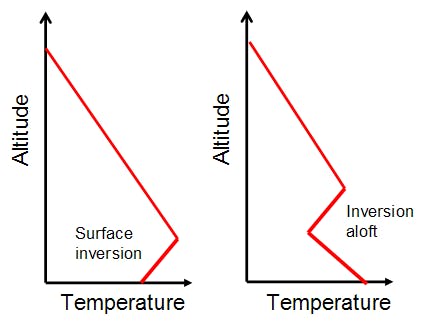
Temperature inversions are often associated with valley cloud.
Credit
pataga.net/WhetherToFLy.html
Idealized vertical temperature profiles showing a surface-based temperature inversion (left) and inversion aloft (right).
A temperature inversion occurs when air at higher elevations is warmer than air at valley bottom. This is a reverse of normal conditions, where air temperature decreases with height.
Temperature inversions form due to many processes, two of which are warm air flooding in aloft and subsidence. In the first case, a warm front moving into British Columbia will cause warm air to rise up and over cooler, denser air settled in valley bottoms. If this elevated air mass is above 0 C, rain may occur in the alpine or treeline, with freezing rain or ice pellets falling in valley bottoms.
Alternatively, when high pressure is in place for multiple days, air descending to the surface of the Earth (subsiding) can create a temperature inversion up high known as a subsidence inversion. Warm, sunny conditions may exist at mountain top, while cool, often cloudy conditions are found at valley bottom.
Surface-based inversions also form due to overnight heat loss at ground level, and the subsequent cooling of adjacent layers of air.
During a temperature inversion, dramatic warming of the snowpack can occur during the day at alpine elevations. This warming may not be obvious to a person traveling at lower, cooler elevations, and may increase threats posed by overhead hazards.
Once in place, this stagnant weather pattern is challenging to break.
The lifted wedge of warm air is indicated by a dashed blue line with red hooks (circled in yellow).
TROWAL is an acronym for "trough of warm air aloft". It is used on Canadian weather maps, instead of an occluded front, to illustrate the position of the warm front pinched off from the surface by the faster-moving cold front.
The red line with semi-circles shows a warm front moving into BC from the Pacific Ocean.
Credit
M. Pidwirny
A bird’s eye view of a low pressure system and its associated fronts. Coloured arrows indicate wind direction and air temperature.
Credit
M. Pidwirny
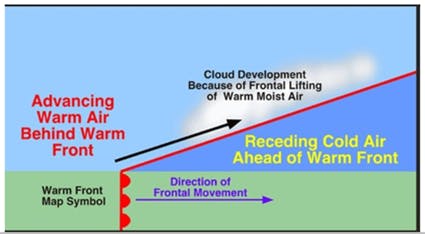
A vertical slice through a warm front showing the gradual ascent of warm, moist air over the cold air it is advancing upon.
A warm front is the interface that occurs when a warm air mass replaces a retreating cold air mass. Warm fronts generate atmospheric lift as their associated low-density air mass climbs up and over the cooler, denser air it advances upon. This gradual overrunning of warm, moist air produces clouds and precipitation well ahead of the warm front’s surface position. Warm fronts are represented on weather maps by a solid red line with red semicircles pointing in the direction the front is moving.
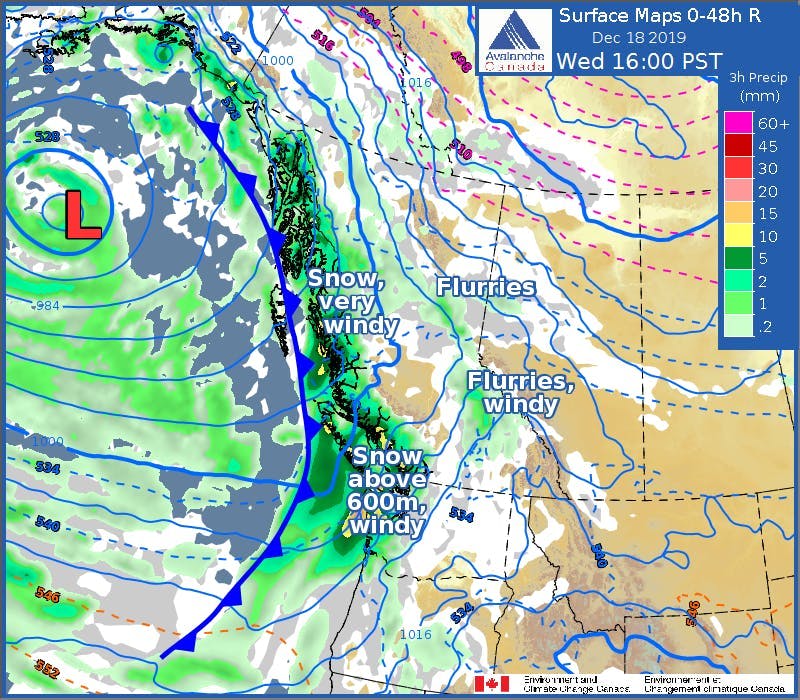
The weather map shows a stationary arctic front (red line/semi-circles and blue line/triangles) draped along the Alaskan Panhandle, B.C.’s Coast Mountains, and through the Southern Interior. A low pressure system approaches Vancouver Island with its warm front (red line and semicircles), cold front (blue line and triangles), and TROWAL (blue dashed line with red hooks).
A weather front is the interface between two air masses with differing characteristics such as the border between a cold, dry air mass, and a warmer, wetter one. They are named for their abrupt transitions in temperature (e.g. warm front, cold front), but significant changes in other weather elements such as moisture content, wind speed and direction, and cloud clover also tend to occur. The interface itself is not a vertical wall, rather it’s a sloped surface tilting toward the cold air.