- Date
- Thursday, January 4, 2024
- Author
- Simon Horton, Research Officer
Last winter, avalanche forecasts in Canada switched from fixed regions to a new system where region boundaries can change based on backcountry conditions. To implement this system, we created "subregions" from our old, large regions. We initially thought this could be done mainly by analyzing terrain and climate factors, but the process ended up heavily focusing on other factors such as backcountry usage patterns alongside terrain and climate. It was a fascinating process for us in the forecasting team, and it inspired us to write this blog for map “keeners” who want to know how Canadian forecast regions were split into 123 subregions.
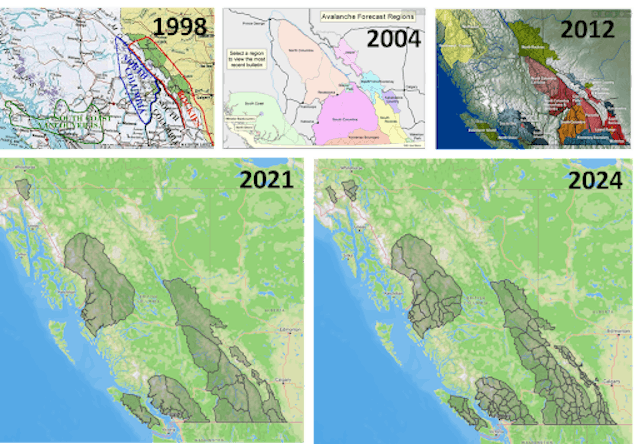
Progression of public forecast regions in western Canada from 1998, 2004, 2012, 2021, and 2024 (regions for Quebec and Newfoundland are not shown).
Terrain, climate, and recreation patterns
In the summer of 2022, forecasters were tasked with splitting their large regions into smaller polygons that could be dynamically grouped. There were some obvious splits, like separating the Duffey and Coquihalla areas in the former South Coast Inland region, while other areas had less clear criteria that required digging deeper. We supplemented our existing knowledge of the regions with several datasets:
- Defined boundaries from regional districts (e.g., watersheds, wildlife management units, biogeoclimatic regions).
- Terrain data including elevation and land cover (e.g., forest type, treeline elevation, glaciation).
- Precipitation and temperature climatologies.
- Historical locations of Mountain Information Network reports.
- Areas in the Trip Planner with Avalanche Terrain Exposure Scale ratings.
- Locations of critical data sources such as automated weather stations and professional avalanche operations.
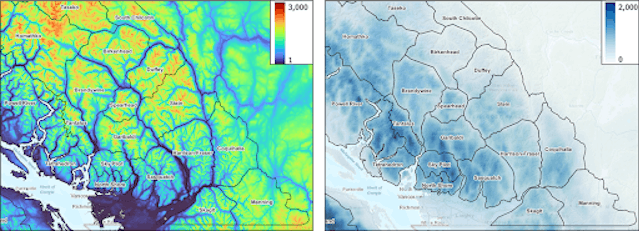
Physical factors considered included terrain and climate. The left image shows elevations (m) in the south coast and the right image shows the annual precipitation (mm) from PRISM.
In many cases, neither pre-defined regions nor an automated analysis of physical terrain and climate factors produced results that made sense from the perspective of backcountry recreation. It became clear the top priority should be creating regions that split backcountry recreation areas into groups that often experience distinct avalanche conditions. When looking at our proxies for recreational use (e.g., MIN reports, ATES-rated areas), the necessary subregions became fairly obvious. Except for some of the more remote areas, where usage patterns were unclear and terrain and climate factors had to play a bigger role.

Proxies for recreational patterns in the south coast included historic MIN report locations (brown dots) and ATES-rated areas in the Trip Planner (purple polygons).
Where to draw boundaries?
Once we established key recreation areas, a technical challenge became drawing the boundaries between subregions. A primary consideration was to avoid drawing boundaries through recreation areas. This way someone planning a trip would only need to read one forecast, as opposed to travelling through multiple forecast regions in a single day trip. This typically led to drawing boundaries in low terrain (e.g., following rivers and roads, passing through cols) rather than high terrain (e.g., following watersheds, ridgelines, and peaks).
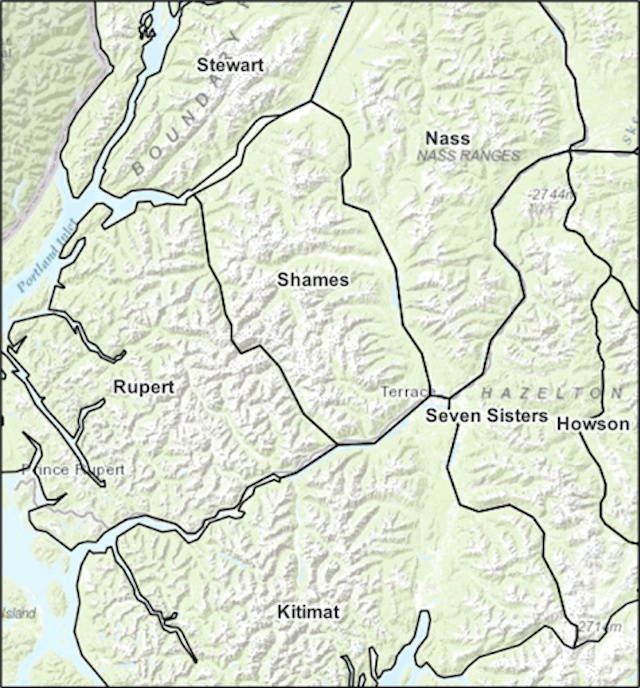
Subregion boundaries in the Terrace area primarily follow low terrain.
Dividing subregions with low terrain produces subregions that contain both the wet and dry sides of mountain ranges, which leaves climatic variability within each subregion as the windward side of ranges tends to be wetter. However, wet and dry areas within a mountain range rarely follow obvious lines and typically require extensive local knowledge of how weather systems interact with the terrain. We used different methods to carefully delineate wet and dry areas wherever possible, using local knowledge and even forestry data in some places. (Wet areas tended to have more hemlock and cedar, as opposed to pine and fir in the dry areas.)
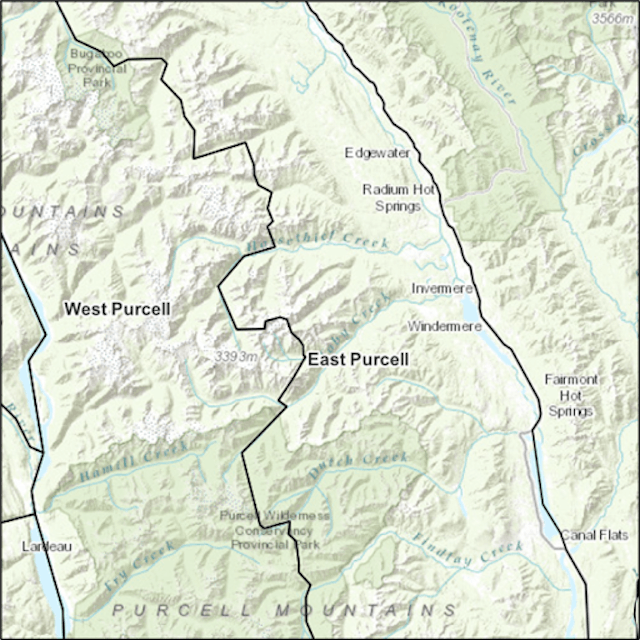
The subregion boundary in the central Purcells was divided into wet and dry areas using local knowledge.
The finished product
The draft subregions from each forecasting agency were merged into a master map to cover all Canadian avalanche forecasts. Avalanche Canada, Avalanche Quebec, Banff Yoho Kootenay National Parks, Jasper National Park, and Kananaskis Country created new subregions, while Glacier and Waterton National Parks did not subdivide their areas. The merged map was fine-tuned using QGIS and then published in geojson, kml, and shapefile formats at https://github.com/avalanche-canada/forecast-polygons. This map was imported into our forecast publishing software, where forecasters can dynamically group and move subregions between forecasts.
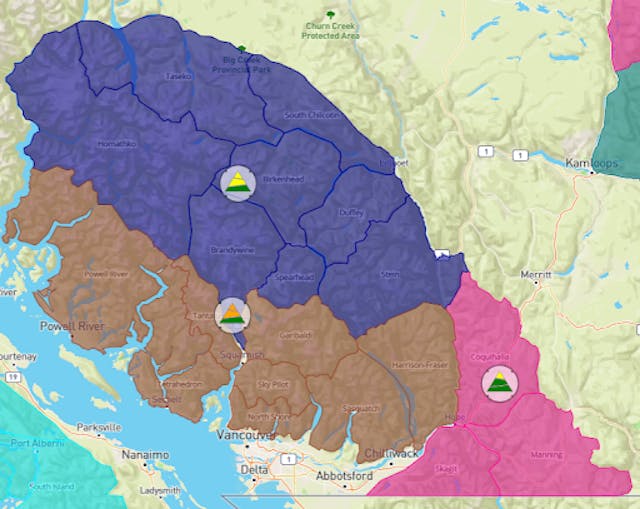
Screenshot of our forecast publishing software showing a draft arrangement of forecast regions and danger ratings for the south coast.
How it has worked so far
We used the flexible system for the first time in the 2022-23 winter. While there was a learning curve, it ultimately allowed us to create more homogenous and representative forecast regions. Common reasons for changing region boundaries are storm tracks, which inform the distribution of storm and wind slab avalanche problems, and snowpack observations, which inform the distribution of persistent and deep persistent slab avalanche problems.
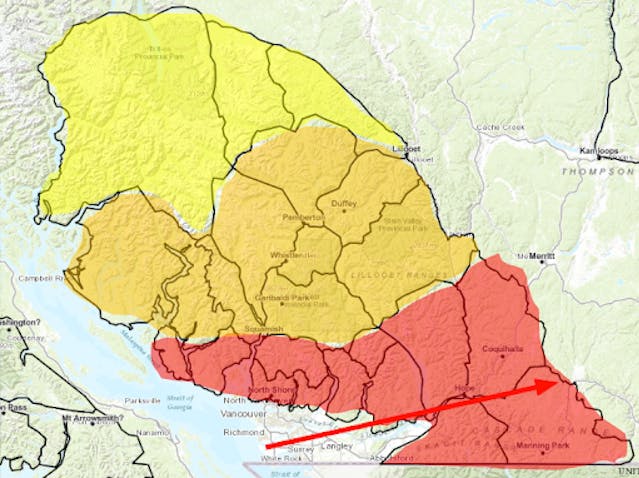
A hypothetical example of a storm track moving from Vancouver to Hope with bands of decreasing danger level towards the north.
Ryan Buhler, our Forecast Program Supervisor, wrote a paper for the 2023 International Snow Science Workshop analyzing the grouping of subregions during their inaugural season (link below). Based on experience from this first winter, minor revisions to the subregions were made over the 2023 summer. During the first few weeks of the 2023-24 winter, our forecasters have been applying the dynamic regions more fluidly as we become more familiar with the new system.
Further reading
- Read about the basics of the system at Flexible Forecast FAQs.
- Map of subregions and data sources at ARFI.
- ISSW paper: An analysis of Avalanche Canada's flexible forecast regions.
- ISSW paper: The AvID project: Collaborative solutions to avalanche forecasting challenges.